NCHPH Interactive Maps Tutorial
This tutorial will help you to navigate through our interactive maps and find the information you are looking for.

2020 City Health Behaviors and Outcomes
This map contains data from the CDC’s PLACES Project, formerly known as the 500 Cities Project, and overlaps them with the location of Health Centers and Public Housing Authorities. It provides city- and census tract-level small area estimates for chronic disease risk factors, health outcomes, and clinical preventive services use for the largest 500 cities in the United States. These small area estimates allow cities and health centers to better understand the burden and geographic distribution of health-related variables in their jurisdictions and assist them in planning public health interventions.

2020 Diabetes Map
This map shows different trends in diabetes in public housing such as locations of adults with no activity, obesity rates, etc.

Diabetes in Public Housing Primary Care
Residents of public housing are particularly at risk for developing diabetes and diabetes-related complications due to the many social factors that impact their health. Currently, diabetes prevalence and rates of uncontrolled diabetes (HbA1c>9) remains high for patients at Public Housing Primary Care (PHPC) centers. Click on the interactive map to see how the diabetes data at PHPCs compares to the rates of diabetes at the county level.

Jobs Plus and Health Centers
This map shows the location of Health Centers and Jobs Plus sites. The place-based Jobs Plus Initiative program addresses poverty among public housing residents by incentivizing and enabling employment. For Health Centers interested in partnering with Jobs Plus sites, visit this NCHPH resource and hover over the organization you want to partner with. The contact information will then be displayed.

Health Behaviors and Public Housing
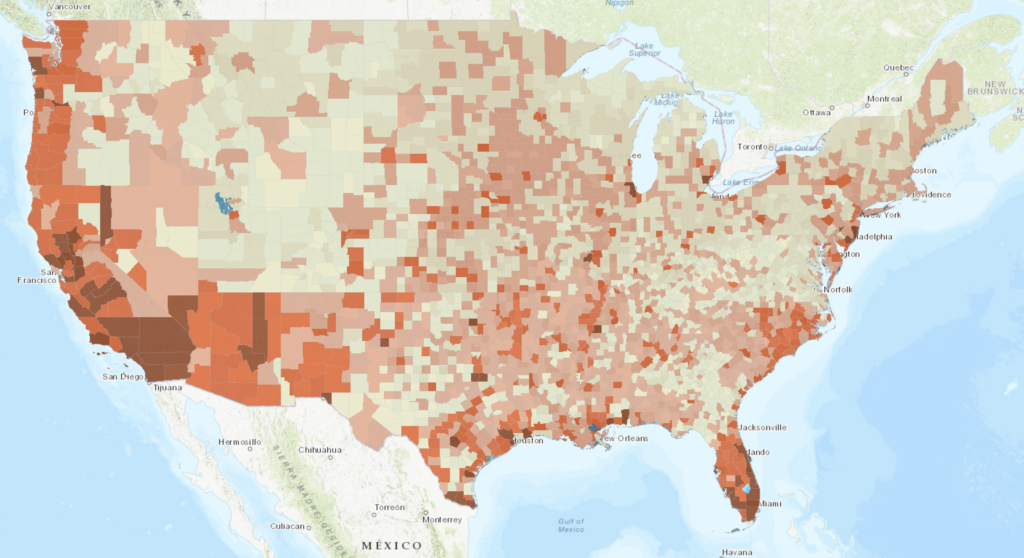
Health behaviors are detrimental actions that heightened the odd of illness and impede recovery. This map depicts some health behaviors by county and the location of PHPC health centers in the nation.

Health Centers and Other Health Care Facilities Close to Public Housing Developments
This map shows health care facilities within a five mile radius of public housing buildings and public housing authorities. As the default, only PHAs and Health Center service delivery sites are shown. To view other layers, click the layers icon in the upper right corner. To find health centers near public housing in your state, click on the filter icon (funnel) in the upper left and enter your state abbreviation. To get a list of the health centers, pull up the attribute table at the bottom of the screen.

Health Center Program Grantees and Public Housing Developments
This map shows the location of all Health Center clinical sites and public housing developments in the country. Zoom in to see how close each clinic is to the public housing development and click on the buttons for more detailed information on the name of the Health Center, number of units at the public housing development, and demographic information, such as income, racial and ethnic background, and household composition.

Health Outcomes and Public Housing
This interactive map explores the prevalence of diabetes, low birth weight, poor or fair health and HIV in the U.S. by county, so health centers can compare their performance measures and establish or modify health interventions addressing the health care needs of their communities.

PHPC Grantees and Associated Clinics
There are currently 108 Public Housing Primary Care (PHPC) grantees. This map shows the location of the PHPC and all of the associated clinic sites.

PHPC Environmental Hazards
Responding to a natural disaster can always be improved and more effective when the right preparedness measures are taken in advance. The purpose of this map by the National Center for Health in Public Housing is to provide support to Public Housing Primary Care (PHPC) health centers on how to identify different types of natural disasters that can impact the vulnerable populations they serve based on their geographic region to better prepare for a natural disaster in advance by collaborating with public housing agencies. This map depicts public housing buildings with nearby health centers and a variety of types of disasters such as hurricanes, wildfires, earthquakes, and other natural disasters to prepare for in case of an emergency. Additionally, with this map, health centers can assess their county’s risk of a natural disaster and resilience measures.

Socioeconomic Health Factors and Public Housing
Social and economic factors are strong drivers of how well we live. Across the U.S., people who live in the bottom performance counties face higher rates of unemployment, lower rates of high school graduation and lower median household incomes. This map shows the high and low performers by county and the location of PHPC grantees.
